Fish Pathogen Monitoring Studies
Fish Pathogen Monitoring Studies
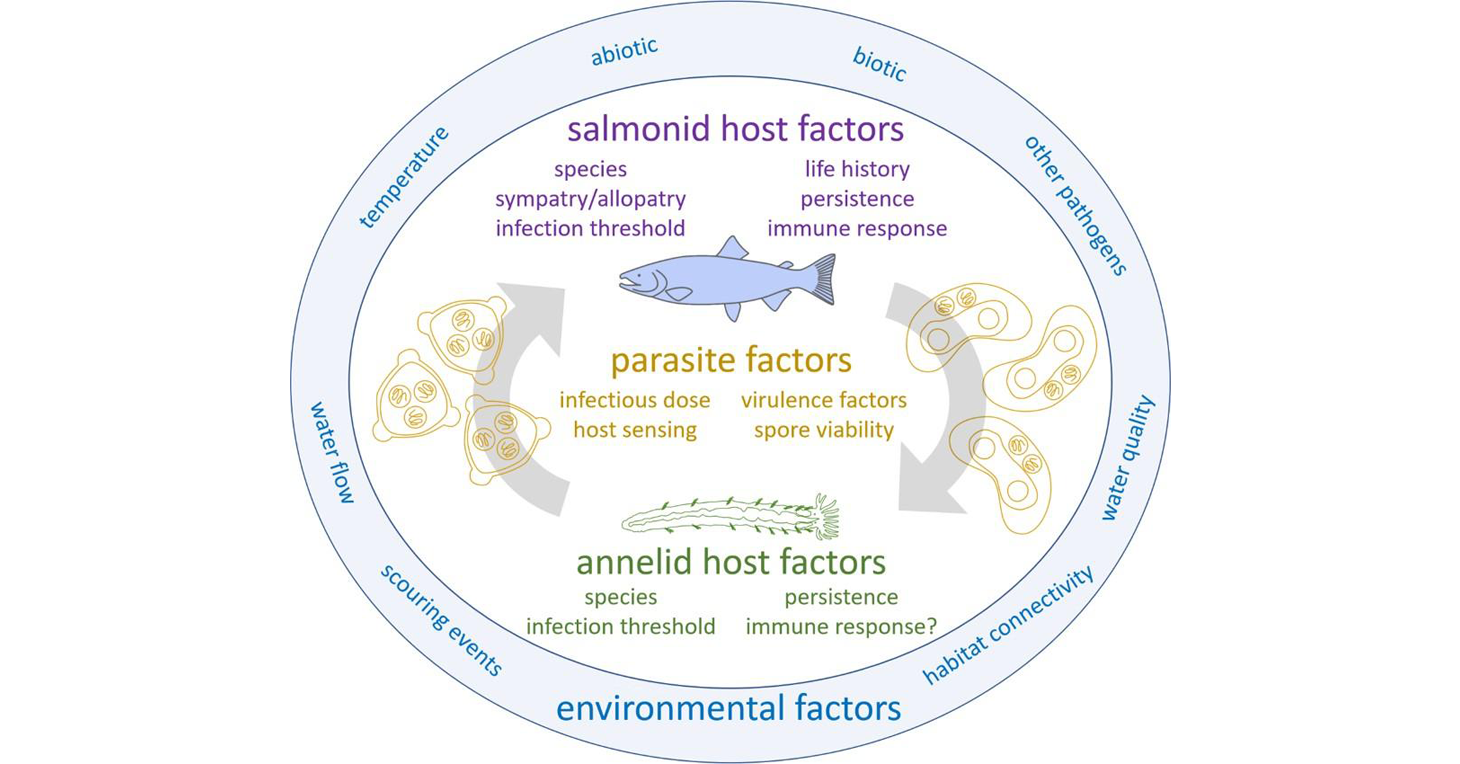
The life cycle of Ceratonova shasta and abiotic and biotic factors that influence the different stages. Published in: Bartholomew JL, Alexander JD, Hallett SL, Alama-Bermejo G, Atkinson SD (2022). Ceratonova shasta: a cnidarian parasite of annelids and salmonids. Parasitology 149, 1862–1875. https://doi.org/10.1017/S0031182022001275
Ceratonova shasta is a freshwater, myxozoan parasite that is native to the Pacific North West of North America. It causes enteronecrosis in juvenile salmonids and is associated with population-level impacts in the Klamath River. Transmission occurs through waterborne stages: actinospores released from annelids infect salmonid fishes and develop into myxospores which then infect annelids (see life cycle, above). The parasite proliferates in each host.
In response to the high prevalence and severity of C. shasta-infection in Klamath salmonids, we developed a parasite monitoring program to track the spatial and temporal abundance of C. shasta. The three main approaches are based on the parasite's life cycle and include sentinel fish exposures, annelid host sampling and molecular quantification of parasite DNA in water samples. These are described in more detail below. Monitoring occurs at established index sites which are shown on the following map.
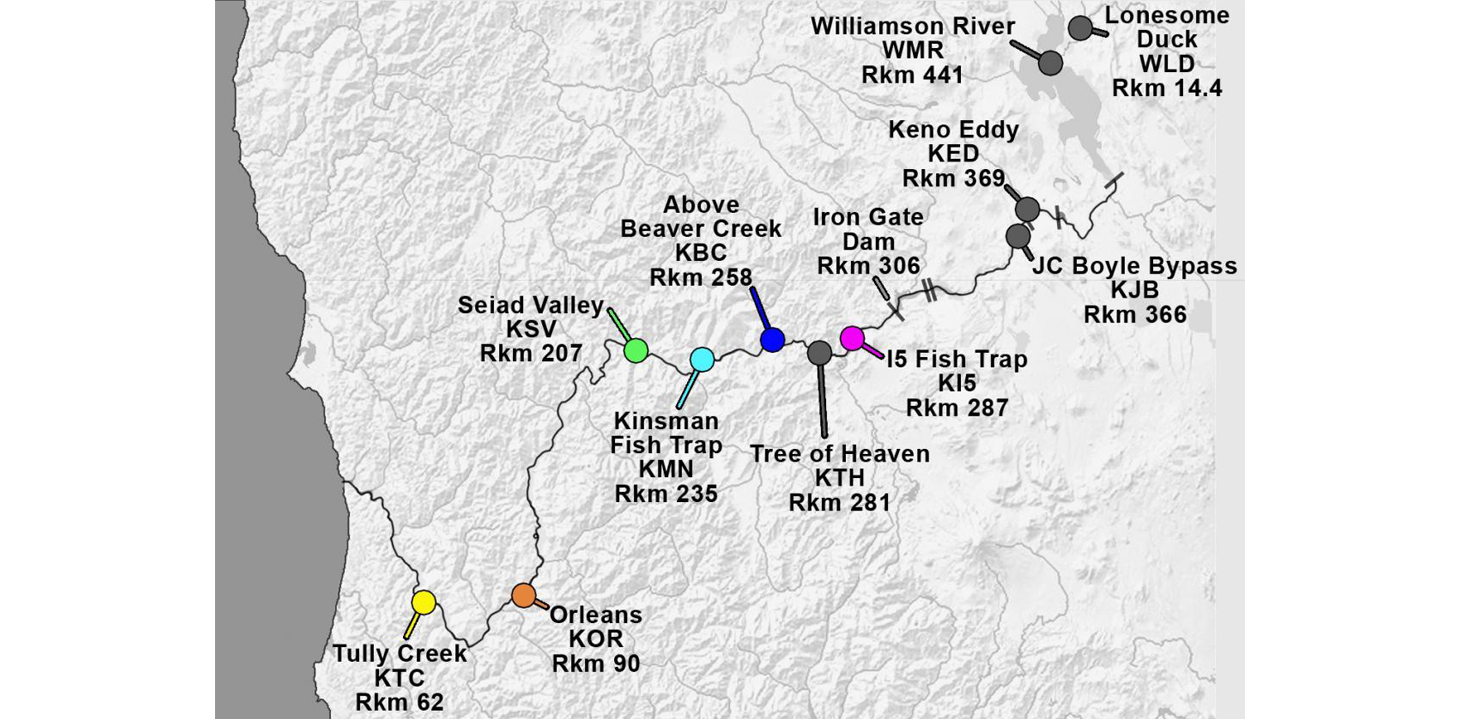
Klamath River Index Sites with site abbreviations and river kilometers (Rkm). Iron Gate Dam (Rkm 306) blocks anadromous salmonid migration.
Data shared here are preliminary and subject to modification.
Page photo credits: S Atkinson, S Hallett & J Alexander
Monitoring Studies are Primarily Supported by the Bureau of Reclamation.
Sentinel fish exposures
In sentinel fish exposures, fish highly susceptible to the parasite (out-of-basin rainbow trout) are placed in cages alongside fish of interest such as in-basin Chinook and coho salmon at index sites along the river for a three day exposure. All fishes are transported to OSU's John L Fryer Aquatic Animal Health Lab and monitored for infection (~ 60 days). Severity of infection (percent morbidity and mean days to morbidity) are recorded through visual observations and molecular assay (PCR).
Juvenile fish being placed in a sentinel cage which is then submerged in the Klamath River
2024 data updates
An April sentinel fish exposure occurred 04/22 - 04/25 at two mainstem sites, KBC and KSV, with Fall Creek Hatchery Fall Chinook and out-of-basin rainbow trout. The status of these fishes can be found at this link.
A May sentinel fish exposure occurred 05/20 - 05/23 at WMR, WDR and KED in the upper basin and at KI5, KBC, KSV and KOR in the lower basin. The status of these fishes can be found at this link.
A third sentinel fish exposure occurred at all index sites June 11-14, 2024. The status of these fishes can be found at this link.
An exposure was scheduled to occur in September at two lower basin sites. However, due to elevated turbidity this was postponed until river conditions improved, October 14-17..
Water samples
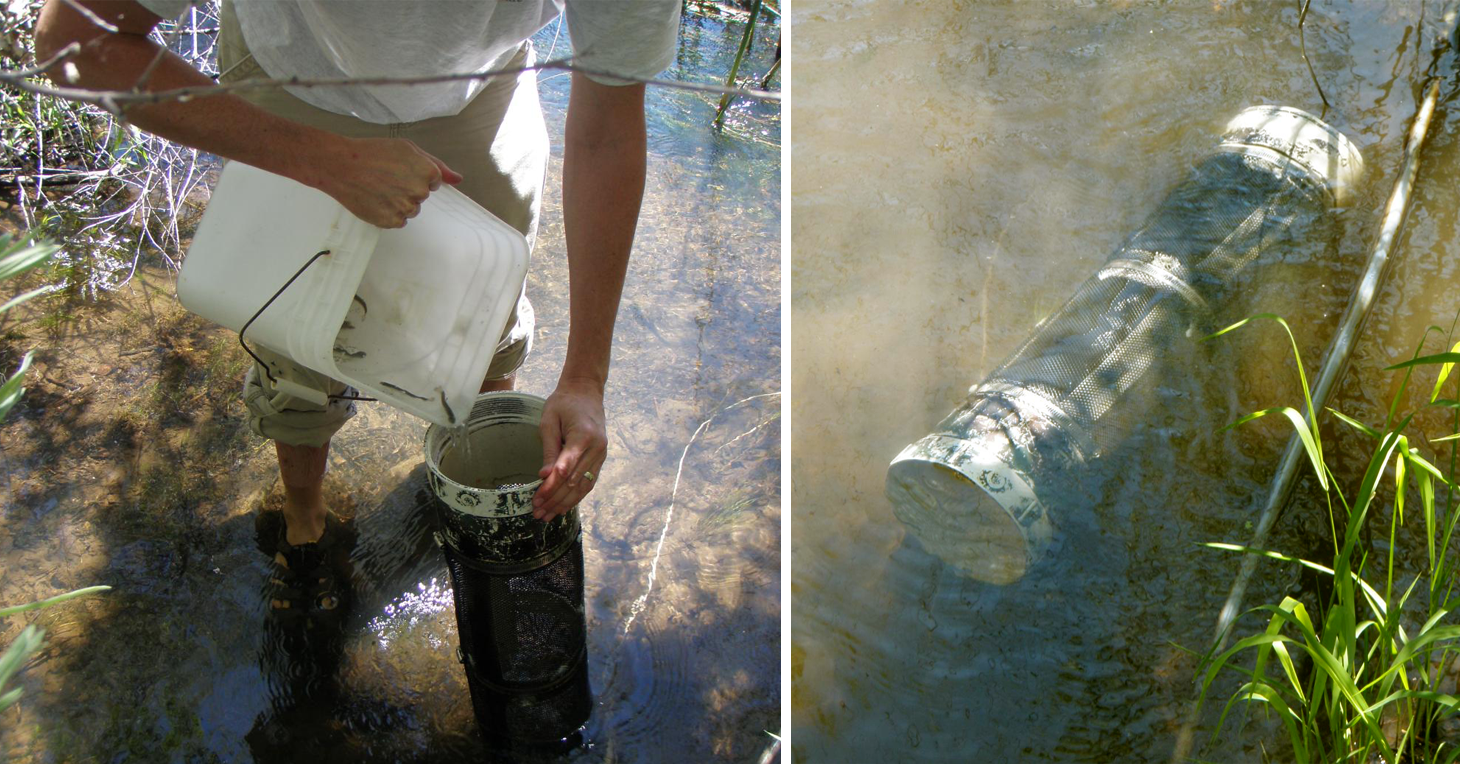
To detect and quantify waterborne stages of C. shasta, river water samples are collected at five mainstem index sites; once a week all year round at two sites (KBC and KSV) and once per week from April through October at three other sites. Solar-powered automatic samplers (ISCOs) collect 1L water every 2 hours for 24 hours, from which 4 1L samples are manually taken (see photos below). Each 1L sample is filtered through a nitrocellulose membrane using a vacuum pump, and any captured DNA in 3 of the replicate samples is extracted using a kit (see images on right). A quantitative PCR (qPCR) specific for C. shasta is used to detect and quantify any parasite DNA present. Cq values generated by the qPCR are converted to numbers of parasite spores per liter of water using reference samples with known quantities of spores. The Karuk and Yurok tribal biologists are integral to the collection and filtration of the water samples. Water samples are also taken in conjunction with the sentinel fish exposures; manual 'grab' samples are collected on the first and last day of the exposure. Data are presented as the average spores per liter of three replicate 1 liter water samples collected at each site and time.
Genotyping
There are multiple genetic types or genotypes of C. shasta simultaneously present in the Klamath River. These differentially disease the various salmonid species. For example, type I causes mortality in Chinook salmon whereas type II can be fatal for coho salmon. Type 0 is found in sympatric Oncorhynchus mykiss (steelhead and redband rainbow trout).
Therefore, we also genotype each water sample. This is done in two ways. For genotyping type II only, we use a qPCR that amplifies the variable ITS1 region specific to that genotype. Whereas, to determine the overall genotype composition of a sample, we amplify the variable ITS1 region common to all genotypes in a PCR and then sequence that amplicon. From the sequencing chromatogram, we can determine the proportion of each genotype present in a sample. We use the total spore density to then determine the number of spores of each genotype in a sample.
Genotyping commences once we detect greater than 1 spore per liter.
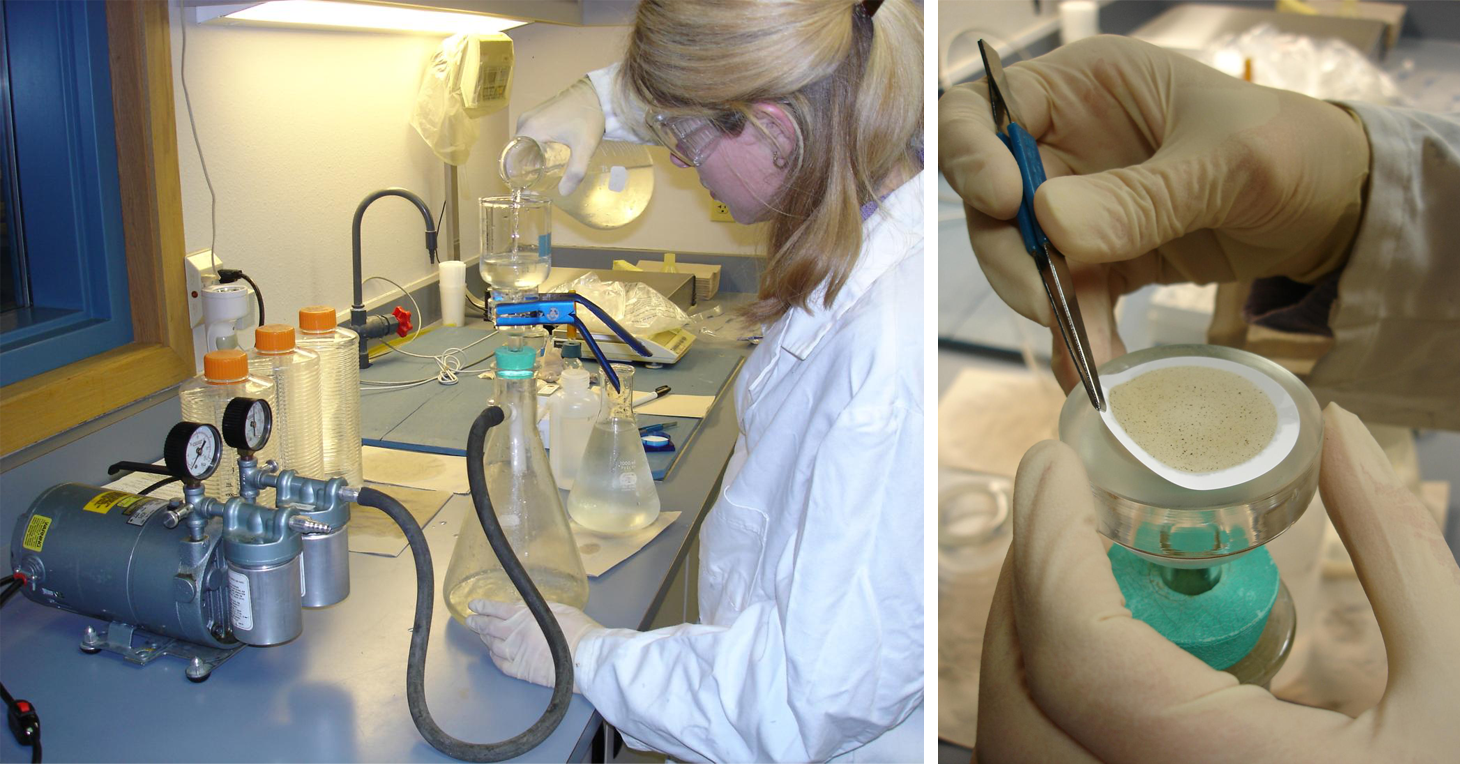
Filtering a water sample using a vacuum pump (left). Folding the filter paper with captured material (right).
2024 data updates
We are still in the Winter collection phase, with only two Klamath River sites sampled each week: KSV & KBC. OSU has received and analyzed water samples up to and including 2/26/2024.
Samples were taken either by ISCO automatic sampler "i" and are given as the average density of C. shasta spores per liter of river water (from 3x 1-L subsamples of a 24-hour composite sample, Sunday-Monday), or taken manually "g" (3 x 1-L samples taken Monday).
No C. shasta DNA has been detected in water, which is not unusual during winter.
Specific results for 2 sites, '-' = no C. shasta DNA detected. If inhibition was detected this is specified. At the end of January and early February the high suspended sediment load caused inhibition of the molecular assay.
01/02/2023
KBC -
KSV -
01/08/2023
KBC - (slight inhibition)
KSV no sample
01/15/2023
KBC - (slight inhibition)
KSV - (totally inhibited)
01/22/2023
KBC - (no inhibition)
KSV - (no inhibition)
01/29/2023
No samples - sediment load too high
02/05/2023
No samples - sediment load too high
02/12/2023
No samples - sediment load too high
02/19/2023
KBC -
KSV -
02/26/2023
KBC -
KSV -
C. shasta DNA was detected in only one subsample collected at KBC and KSV during these three weeks.
Specific results for 2 sites, '-' = no C. shasta DNA detected. If inhibition was detected this is specified.
Sampling at all index sites will commence late March.
03/04/2024
KBC trace (in 1/3 samples)
KSV -
03/12/2024
KBC -
KSV -
03/18/2024
KBC -
KSV -
This was the first week of sampling at all 6 index sites. Multiple sites required double the regular number of filters due to high levels of suspended material.
No C. shasta DNA was detected at any site this week.
03/25/2024
KSH - (substitute site for KI5)
KBC -
KMN -
KSV -
KOR -
KTC -
Due to the higher than usual amount of suspended material in the water column, which renders filtering challenging, less water was filtered at most sites this week (volume indicated). ISCO = automatic water sampler; grab = manual sample. '-' = no C. shasta DNA detected
No C. shasta DNA detected was detected at any site this week, however, the sensitivity of the approach is affected by the high river turbidity.
04/01/2024
KSH - (100ml; grab)
KBC - (100ml; isco)
KMN - (100ml; grab)
KSV - (100ml; isco)
KOR - (250ml; isco)
KTC - (1L; grab)
This was the first week of sampling at all index sites, with expedited sample processing. Multiple sites required a reduction in water volume filtered due to high levels of suspended material. Two sites were sampled with an automatic sampler ("i"), four sites were a manual grab ("grab")(water levels were too high at KTC to deploy an ISCO).
Only trace amounts of Cs-DNA was detected at any of the 6 sites analyzed (at KTC):
04/08/2024
KSH - (100ml; isco)
KBC - (100ml; grab)
KMN trace (1/3 samples positive; 100ml; isco)
KSV - (100ml; grab)
KOR - (250ml; grab)
KTC - (1L; grab)
This was the 2nd week of sampling at all index sites, with expedited sample processing. C. shasta DNA was detected at 5 of the 6 index sites (in at least one of three replicate samples). Because of the higher than usual levels of suspended substrate, subsamples of less than 1L (100 - 350mL) were filtered for each site except the lowermost, KTC.
Estimated spores/L based on low-volume subsamples (reduced owing to ongoing high sediment loads):
04/15/2024
KSH 2/3 samples positive; 100mL; isco; estimated 3 sp/L
KBC 2/3 samples positive; 100mL; isco; estimated 6 sp/L
KMN 3/3 samples positive; 100mL; isco; estimated 5 sp/L
KSV 1/3 samples positive; 100mL; grab; estimated <1 sp/L
KOR 3/3 samples positive; 350mL; isco; estimated 4 sp/L
KTC 0/3 samples positive; 1L; grab; negative
We will test 1 replicate sample with > 5 spores/L from each site for genotype II (coho-relevant). Results: KOR trace detection, KSH, KBC, KMN no detection.
This was the 3rd week of sampling at all index sites, with expedited sample processing. We received samples from 5 of the 6 sites (KTC shipping was delayed). Because of the higher than usual levels of suspended substrate this season, subsamples of less than 1L (150 - 300mL) were filtered for each site.
C. shasta DNA was detected at all 5 sites assessed (in all three of the three replicate samples per site), at higher density than the previous week. Average spore density ranged from 7 spores per liter (at KSV and KOR) up to 57 spores per liter (at KBC). Spore density exceeded 10 spores per liter (Chinook 40% mortality threshold) at 3 sites: the 3 most upstream, KSH, KBC and KMN.
All samples were also assessed for coho type II this week. Trace amounts were detected at 3 of the 5 index sites.
SITE, number of replicates positive, sample volume, method of collection, average total spore density (followed by coho type II results):
KSH 3/3 samples positive; 150ml; isco; estimated 13 sp/L
Type II "coho": 1/3 samples positive, trace sp/L
KBC 3/3 samples positive; 150mL; isco; estimated 57 sp/L
Type II "coho": 1/3 samples positive, trace sp/L
KMN 3/3 samples positive; 150ml; isco; estimated 22 sp/L
Type II "coho": 0/3 samples positive
KSV 3/3 samples positive; 200ml; grab; estimated 7 sp/L
Type II "coho": 1/3 samples positive, trace sp/L
KOR 3/3 samples positive; 300ml; isco; estimated 7 sp/L
Type II "coho": 0/3 samples positive
KTC 3/3 samples positive; 1000ml; isco; estimated 3 sp/L
Type II "coho": 0/3 samples positive
This was the 4th week of sampling at all index sites, with expedited sample processing. Because of the higher than usual levels of suspended substrate this season, subsamples of less than 1L (150 - 400mL) were filtered for each site except KTC (1L).
All samples tested positive for C. shasta this week: C. shasta DNA was detected at all 6 sites assessed, in all three of the three replicate samples per site. Density was higher than the previous week at 4 sites, lower at 2. Average spore density ranged from 2 spores per liter (at KTC) up to 46 spores per liter (at KBC). Spore density exceeded 10 spores per liter (Chinook 40% mortality threshold) at 4 sites (one more than the previous week): the 4 most upstream, KSH, KBC, KMN and KSV.
All samples were also assessed for coho type II. The density of type II was higher throughout the lower basin this week. Type II was detected at 5 of the 6 index sites (all except KTC), from < 1 spore to 3 spores per liter (at KBC).
SITE, number of replicates positive, sample volume, method of collection, average total spore density (followed by coho type II results):
KSH 3/3 samples positive; 200ml; isco; estimated 29 sp/L
2 sp/L type II "coho"
KBC 3/3 samples positive; 150mL isco; estimated 46 sp/L
3 sp/L type II "coho"
KMN 3/3 samples positive; 150ml; isco; estimated 36 sp/L
1 sp/L type II "coho"
KSV 3/3 samples positive; 200ml; grab; estimated 42 sp/L
2 sp/L type II "coho"
KOR 3/3 samples positive; 400ml; isco; estimated 9 sp/L
<1 sp/L type II "coho"
KTC 3/3 samples positive; 1000ml; isco; estimated 2 sp/L
no type II "coho"
This was the 5th week of sampling at all index sites, with expedited sample processing. Because of the higher than usual levels of suspended substrate this season, subsamples of less than 1L (200 - 650mL) were filtered for each site except KTC (standard 1L); greater volumes were able to be filtered this week than last week though.
All samples tested positive for C. shasta this week, but at much reduced spore densities than last week. No inhibition was detected and results have been corrected for volume. The highest density of 4 spores per liter was measured at three sites (KSH, KBC and KSV). Spore density did not exceed the Chinook 40% mortality threshold (of 10 spores per liter) at any site.
All samples were also assessed for coho type II. The density of type II was similar throughout the lower basin this week as last week. Type II was detected at 4 of the 6 index sites (not KTC or KMN), from < 1 spore to 2 spores per liter (at KBC).
05/06/2024
KSH 3/3 samples positive; 200ml; isco; estimated 4 sp/L
1 sp/L type II "coho"
KBC 3/3 samples positive; 200mL isco; estimated 4 sp/L
2 sp/L type II "coho"
KMN 3/3 samples positive; 200ml; isco; estimated 2 sp/L
0 sp/L type II "coho"
KSV 3/3 samples positive; 300ml; grab; estimated 4 sp/L
1 sp/L type II "coho"
KOR 3/3 samples positive; 650ml; isco; estimated 3 sp/L
<1 sp/L type II "coho"
KTC 3/3 samples positive; 1000ml; grab; estimated <1 sp/L
no type II "coho"
This was the 6th week of sampling at all index sites, with expedited sample processing. Because of the higher than usual levels of suspended substrate this season, subsamples of less than 1L (200 - 450mL) were filtered for each site except KTC (standard 1L).
All samples tested positive for C. shasta this week. The highest density of 25 spores per liter was measured at KBC. Spore density exceeded the Chinook 40% mortality threshold (of 10 spores per liter) at 5 of 6 sites (all except lowermost site, KTC).
All samples were also assessed for coho type II. The density of type II in the lower basin was higher than last week. Type II was detected in all samples for the first time this week, from < 1 spore to 3 spores per liter (at KBC & KSH); .
SITE, number of replicates positive, sample volume, method of collection, average total spore density (followed by coho type II results):
KSH 3/3 samples positive; 200ml; isco; estimated 15 sp/L
3 sp/L type II "coho"
KBC 3/3 samples positive; 200mL isco; estimated 25 sp/L
3 sp/L type II "coho"
KMN 3/3 samples positive; 250ml; isco; estimated 14 sp/L
2 sp/L type II "coho"
KSV 3/3 samples positive; 350ml; grab; estimated 16 sp/L
2 sp/L type II "coho"
KOR 3/3 samples positive; 450ml; isco; estimated 11 sp/L
2 sp/L type II "coho"
KTC 3/3 samples positive; 1000ml; isco; estimated 3 sp/L
<1 sp/L type II "coho"
This was the 7th week of sampling at all index sites, with expedited sample processing. Because of the higher than usual levels of suspended substrate this season, subsamples of less than 1L (200 - 450mL) were filtered for each site except KTC (standard 1L).
All samples tested positive for C. shasta again this week. The highest density of 12 spores per liter was measured at KBC. Spore density met or exceeded the Chinook 40% mortality threshold (of 10 spores per liter) at 2 of 6 sites (KBC & KMN).
All samples were also assessed for coho type II. Type II was detected in all samples and met or surpassed the coho 40% mortality threshold (of 5 spores/L) at the three upstream sites (KSH, KBC & KMN); type II comprised 50% or more of the total C. shasta at these sites.
SITE, number of replicates positive, sample volume, method of collection, average total spore density (followed by coho type II results):
KSH 3/3 samples positive; 200ml; isco; estimated 7 sp/L
5 sp/L type II "coho"
KBC 3/3 samples positive; 200mL isco; estimated 12 sp/L
6 sp/L type II "coho"
KMN 3/3 samples positive; 250ml; isco; estimated 10 sp/L
5 sp/L type II "coho"
KSV 3/3 samples positive; 350ml; grab; estimated 6 sp/L
1 sp/L type II "coho"
KOR 3/3 samples positive; 450ml; isco; estimated 5 sp/L
1 sp/L type II "coho"
KTC 3/3 samples positive; 1000ml; isco; estimated 2 sp/L
<1 sp/L type II "coho".
This was the 8th week of sampling at all index sites, with expedited sample processing. Because of the higher than usual levels of suspended substrate this season, subsamples of less than 1L (200 - 400mL) were filtered for each site except KTC (standard 1L).
C. shasta was detected in all samples again this week. Densities remained similar or increased up to two-fold (at KSH). The highest density of 18 spores per liter was measured at KBC. Spore density met or exceeded the Chinook 40% mortality threshold (of 10 spores per liter) at 3 of 6 sites (uppermost sites: KSH, KBC & KMN).
All samples were also assessed for coho type II. Type II was detected in all samples. Densities were similar to last week except at KBC which had halved. The coho 40% mortality threshold (of 5 spores/L) was met at one site (KMN).
SITE, number of replicates positive, sample volume, method of collection, average total spore density (followed by coho type II results):
KSH 3/3 samples positive; 350ml; isco; estimated 16 sp/L
4 sp/L type II "coho"
KBC 3/3 samples positive; 200mL isco; estimated 12 sp/L
3 sp/L type II "coho"
KMN 3/3 samples positive; 300ml; isco; estimated 18 sp/L
5 sp/L type II "coho"
KSV 3/3 samples positive; 400ml; grab; estimated 9 sp/L
1 sp/L type II "coho"
KOR 3/3 samples positive; 350ml; isco; estimated 5 sp/L
1 sp/L type II "coho"
KTC 3/3 samples positive; 1000ml; isco; estimated 3 sp/L
<1 sp/L type II "coho"
This was the 9th week of sampling at all index sites, with expedited sample processing. Because of the higher than usual levels of suspended substrate this season, subsamples of less than 1L (250 - 500mL) were filtered for each site except KTC (standard 1L).
All samples tested positive for C. shasta again this week. The highest density of 19 spores per liter was measured at KSH, upstream of KBC. Spore density met or exceeded the Chinook 40% mortality threshold (of 10 spores per liter) at 2 sites (uppermost sites: KSH & KMN).
All samples were also assessed for coho type II. Type II was detected in all samples. The coho 40% mortality threshold (of 5 spores/L) was not met at any site; the highest density of 3 spores per liter also was measured at KSH.
SITE, number of replicates positive, sample volume, method of collection, average total spore density (followed by coho type II results):
KSH 3/3 samples positive; 250mL; isco; estimated 19 sp/L
3 sp/L type II "coho"
KBC 3/3 samples positive; 250mL; isco; estimated 5 sp/L
1 sp/L type II "coho"
KMN 3/3 samples positive; 250mL; isco; estimated 11 sp/L
2 sp/L type II "coho"
KSV 3/3 samples positive; 350mL; grab; estimated 6 sp/L
1 sp/L type II "coho"
KOR 3/3 samples positive; 500mL; isco; estimated 8 sp/L
1 sp/L type II "coho"
KTC 3/3 samples positive; 1000mL; isco; estimated 5 sp/L
<1 sp/L type II "coho"
This was the 10th week of sampling at all index sites, with expedited sample processing. Because of the higher than usual levels of suspended substrate this season, subsamples of less than 1L (250 - 500mL) were filtered for each site.
All samples tested positive for C. shasta again this week, however, densities were low at all sites sampled. The highest density of 5 spores per liter was measured at KTC. Spore density was below the Chinook 40% mortality threshold (of 10 spores per liter) at all sites.
All samples were also assessed for coho type II. Type II was detected in all samples but the coho 40% mortality threshold (of 5 spores/L) was not met at any site; the highest density of 1 spore per liter was measured at KSV.
SITE, number of replicates positive, sample volume, method of collection, average total spore density (followed by coho type II results):
KSH 3/3 samples positive; 250ml; isco; estimated 3 sp/L
<1 sp/L type II "coho"
KBC 3/3 samples positive; 350mL isco; estimated 3 sp/L
<1 sp/L type II "coho"
KMN 3/3 samples positive; 300ml; isco; estimated 1 sp/L
trace type II "coho"
KSV 3/3 samples positive; 300ml; grab; estimated 3 sp/L
1 sp/L type II "coho"
KOR 2/3 samples positive; 500ml; isco; estimated <1 sp/L
trace type II "coho"
KTC 3/3 samples positive; 1000ml; isco; estimated 5 sp/L
x sp/L type II "coho"
This was the 11th week of sampling at all index sites, and the final week with expedited sample processing. Because of the higher than usual levels of suspended substrate this season, subsamples of less than 1L (250 - 500mL) were filtered for each site, with the exception of KTC (standard 1L).
Waterborne C. shasta was detected at all sites again this week, and densities were again low. The highest average density of 4 spores per liter was measured at KOR. Spore density was below the Chinook 40% mortality threshold (of 10 spores per liter) at all sites.
Coho type II analysis is underway but with total C. shasta being < 5 spores per liter, coho type II will be below the coho 40% mortality threshold at all sites in the lower basin.
SITE, sample volume, method of collection, average total spore density (followed by coho type II results):
KSH 250ml; isco; estimated 3 sp/L
KBC 250mL isco; estimated 2 sp/L
KMN 250ml; isco; estimated 3 sp/L
KSV 300ml; grab; estimated 2 sp/L
KOR 500ml; isco; estimated 4 sp/L
KTC 1000ml; isco; estimated 1 sp/L
Because of the higher than usual levels of suspended substrate this season, subsamples of less than 1L (250 - 500mL) were filtered for each site, with the exception of KTC (standard 1L). Indeed, sediment loads inhibited some of the 6/24 site analyses and these will be repeated.
Waterborne C. shasta was detected at 6/7 sites this week, with densities below 10 spores per liter (but inhibition detected may mask a higher density). Spore density was below the Chinook 40% mortality threshold (of 10 spores per liter) at all sites.
SITE, sample volume, method of collection, average total spore density:
KSH 0/3 samples positive; 300mL; isco; 0 sp/L (inhibition - will be re-assayed)
KBC 3/3 samples positive; 250mL isco; estimated 7 sp/L
KMN 3/3 samples positive; 250mL; isco; estimated 7 sp/L (inhibition - will be re-assayed)
KSV 3/3 samples positive; 400mL; grab; estimated 5 sp/L
KOR 3/3 samples positive; 500mL; isco; estimated 8 sp/L (inhibition - will be re-assayed)
KTC 3/3 samples positive; 1000mL; isco; estimated 3 sp/L (inhibition - will be re-assayed)
Because of the higher than usual levels of suspended substrate this season, subsamples of less than 1L (250 - 500mL) were filtered for each site, with the exception of KTC (standard 1L).
Waterborne C. shasta was detected at all sites this week, with densities below 10 spores per liter (the Chinook 40% mortality threshold).
SITE, sample volume, method of collection, average total spore density:
KSH 1/3 samples positive; 250mL; isco; trace sp/L
KBC 3/3 samples positive; 250mL isco; estimated 5 sp/L
KMN 3/3 samples positive; 250mL; isco; estimated 3 sp/L; this is the final KMN sample of the season
KSV 3/3 samples positive; 300mL; grab; estimated 3 sp/L
KOR 3/3 samples positive; 500mL; isco; estimated 2 sp/L
KTC 3/3 samples positive; 1000mL; isco; estimated 4 sp/L
Because of the higher than usual levels of suspended substrate this season, subsamples of less than 1L (150 - 250mL) were filtered for each site.
Waterborne C. shasta was detected at 4/5 sites this week (exception = KOR), but densities were low (at, or below 5 spores per liter).
SITE, sample volume, method of collection, average total spore density:
KSH 3/3 samples positive; 150mL; grab; 2 sp/L
KBC 3/3 samples positive; 150mL isco; estimated 2 sp/L
KSV 3/3 samples positive; 150mL; grab; estimated 1 sp/L
KOR 0/3 samples positive; 200mL isco; estimated 0 sp/L
KTC 3/3 samples positive; 250mL; isco; estimated 5 sp/L
Estimated spores/L based on low-volume subsamples: 7/15 were quite turbid and therefore only low volumes of water could be sampled (this decreases the probability of detecting and estimating low parasite densities accurately).
SITE, sample volume, method of collection, average total spore density:
KSH 3/3 samples positive; 150mL; grab; 1 sp/L
KBC 3/3 samples positive; 150mL isco; estimated 1 sp/L
KSV 1/3 samples positive; 200mL; grab; estimated <1 sp/L
KOR 2/3 samples positive; 350mL; isco; estimated 2 sp/L
KTC 3/3 samples positive; 500mL; isco; estimated 1 sp/L
Estimated spores/L based on low-volume subsamples: 7/22 were quite turbid and therefore only low volumes of water could be sampled (this decreases the probability of detecting and estimating low parasite densities accurately).
SITE, sample volume, method of collection, average total spore density:
KSH 2/3 samples positive; 100ml; grab; 1 sp/L
KBC 2/3 samples positive; 100mL isco; estimated 1 sp/L
KSV 3/3 samples positive; 100ml; grab; estimated <1 sp/L
KOR 0/3 samples positive; 100ml; isco; estimated 0 sp/L
KTC 3/3 samples positive; 1000ml; grab; estimated 1 sp/L
Estimated spores/L based on low-volume subsamples: turbidity pulses mean some weeks have lower volumes that can be filtered (this decreases the probability of detecting and estimating low parasite densities accurately).
SITE, sample volume, method of collection, average total spore density:
KSH 3/3 samples positive; 200mL; isco; <1 sp/L
KBC 3/3 samples positive; 200mL isco; 2 sp/L
KSV 2/3 samples positive; 200mL; isco; <1 sp/L
KOR 3/3 samples positive; 200mL; isco; 3 sp/L
KTC 3/3 samples positive; 500mL; isco; 2 sp/L
Estimated spores/L based on low-volume subsamples: turbidity pulses mean some weeks have lower volumes that can be filtered (this decreases the probability of detecting and estimating low parasite densities accurately).
SITE, sample volume, method of collection, average total spore density:
KSH 3/3 samples positive; 100mL; isco; 2 sp/L
KBC 2/3 samples positive; 150mL isco; 1 sp/L
KSV 2/3 samples positive; 150mL; isco; <1 sp/L
KOR 3/3 samples positive; 300mL; isco; 5 sp/L
KTC 3/3 samples positive; 1000mL; isco; 1 sp/L
Estimated spores/L based on low-volume subsamples: turbidity pulses mean some weeks have lower volumes that can be filtered (this decreases the probability of detecting and estimating low parasite densities accurately).
SITE, sample volume, method of collection, average total spore density:
KSH 3/3 samples positive; 150mL; isco; 1 sp/L
KBC 3/3 samples positive; 150mL isco; 1 sp/L
KSV 0/3 samples positive; 150mL; isco; 0 sp/L
KOR 3/3 samples positive; 250mL; isco; 1 sp/L
KTC 3/3 samples positive; 1000mL; isco; <1 sp/L
Estimated spores/L based on low-volume subsamples: turbidity pulses mean some weeks have lower volumes that can be filtered (this decreases the probability of detecting and estimating low parasite densities accurately).
SITE, sample volume, method of collection, average total spore density:
KSH 3/3 samples positive; 100mL; isco; 7 sp/L
KBC 3/3 samples positive; 150mL isco; 22 sp/L
KSV 3/3 samples positive; 150mL; grab; 8 sp/L
KOR 3/3 samples positive; 200mL; isco; 4 sp/L
KTC 3/3 samples positive; 250mL; isco; 4 sp/L
Estimated spores/L based on low-volume subsamples (except KTC): turbidity pulses mean some weeks have lower volumes that can be filtered (this decreases the probability of detecting and estimating low parasite densities accurately). Densities were at or above 10 spores per liter 3/5 sites this week.
SITE, sample volume, method of collection, average total spore density:
KSH 3/3 samples positive; 100mL; isco; 4 sp/L
KBC 3/3 samples positive; 100mL isco; 21 sp/L
KSV 3/3 samples positive; 100mL; isco; 13 sp/L
KOR 3/3 samples positive; 150mL; isco; 4 sp/L
KTC 3/3 samples positive; 1000mL; isco; 10 sp/L
Removal of the final dam elements have resulted in high turbidity in the Klamath River at our sampling index sites since September, rendering water samples difficult or impossible to filter. Hence only minimal spore data are available into October.
Estimated spores/L based on low-volume subsamples: turbidity pulses mean some weeks have lower volumes that can be filtered (this decreases the probability of detecting and estimating low parasite densities accurately ).
09/02/2024 water not filterable
09/09/2024 water not filterable
09/16/2024 water from most sites not filterable. Small volume samples from KOR and KTC:
KOR 2/3 samples positive; 100ml; isco; 2 sp/L (dirty samples, not homogenized prior to filtration)
KTC 3/3 samples positive; 100ml; isco; 1 sp/L
09/23/2024 water from most sites not filterable. Small volume samples from KOR and KTC:
KOR 2/3 samples positive; 100ml; isco; <1 sp/L
KTC 0/3 samples positive; 100ml; isco; 0 sp/L
09/30/2024 water from most sites not filterable. Small volume samples from KTC:
KTC 0/3 samples positive; 100ml; isco; 0 sp/L
10/07/2024 water from most sites not filterable. Small volume samples from KTC:
KTC 0/3 samples positive; 100ml; isco; 0 sp/L
10/14/2024 Small volume samples from all sites:
KSH 2/3 samples positive; 100mL; isco; <1 sp/L
KBC 2/3 samples positive; 100mL isco; <1 sp/L
KSV 1/3 samples positive; 100mL; isco; <1 sp/L
KOR 0/3 samples positive; 100mL; isco; 0 sp/L
KTC 0/3 samples positive; 100mL; isco; 0 sp/L
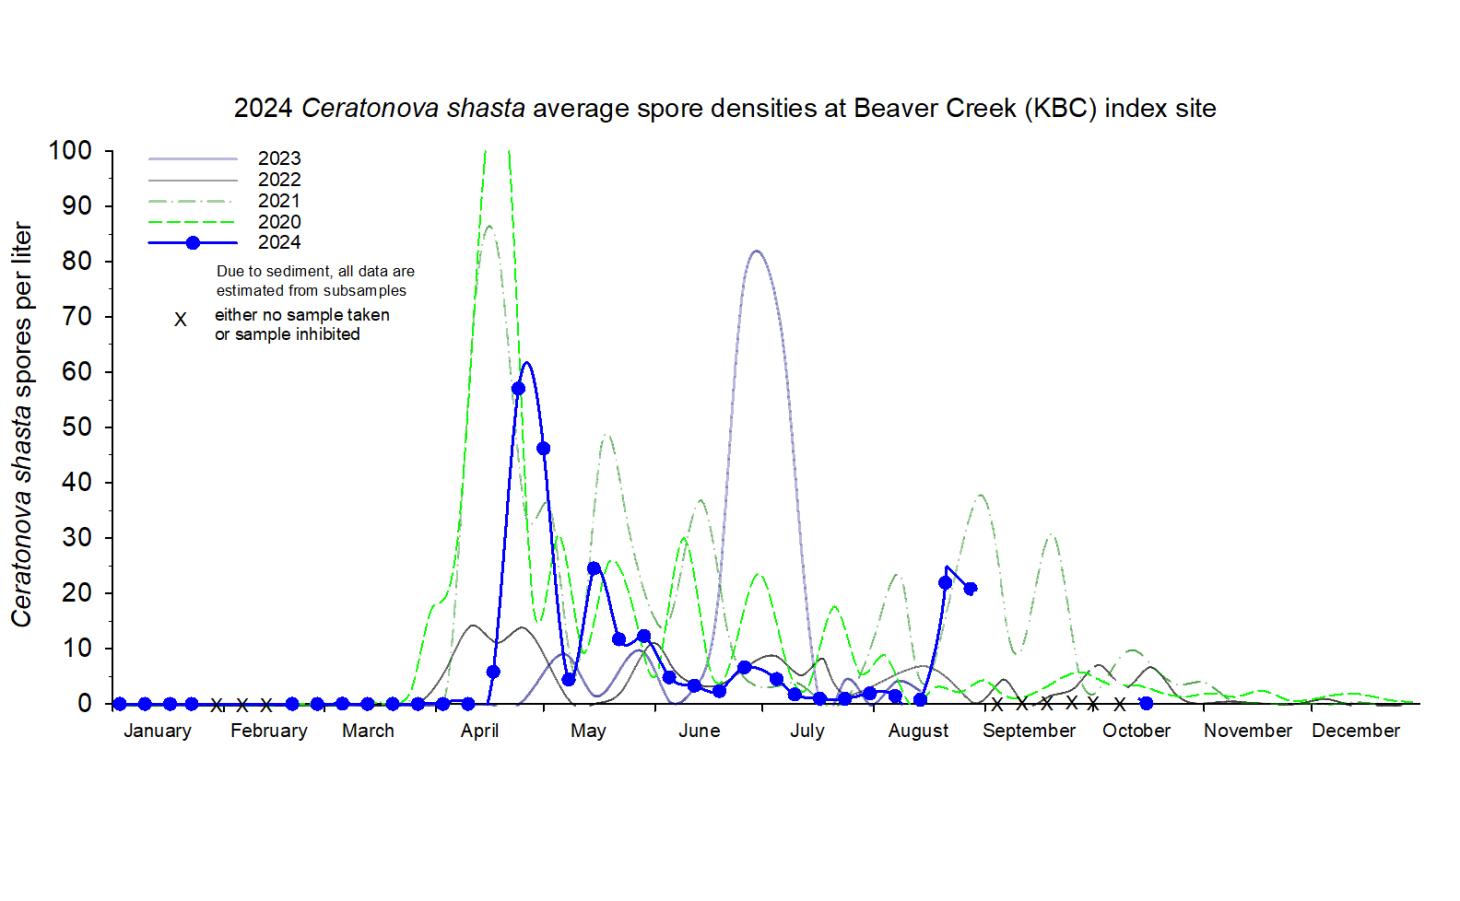
Density (average spores per liter) of Ceratonova shasta in 24-hour composite water samples collected at the mainstem long term index site, near Beaver Creek (KBC) in 2024 (blue data points) compared to the previous years (2020-2023).
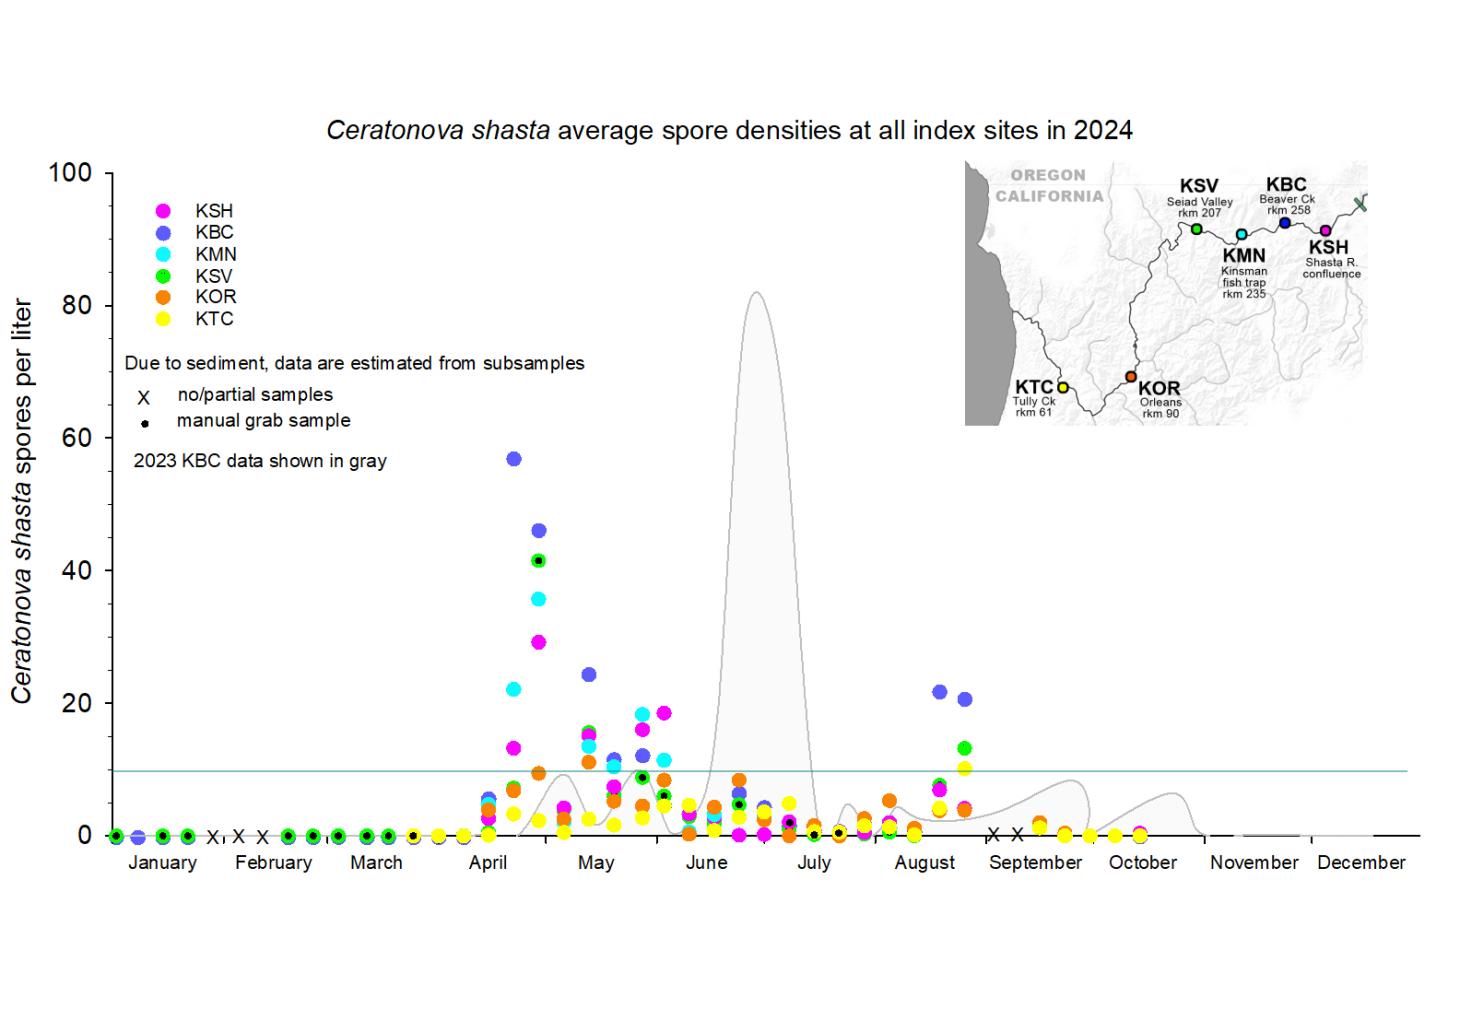
Density (average spores per liter) of Ceratonova shasta in 24-hour composite water samples collected at the mainstem index sites in 2024. Note that KMN is sampled only during salmonid outmigration, KBC and KSV year round and remaining sites April through October. KBC = near Beaver Creek, KSV = Seiad Valley, KSH = near Shasts River, KTC = Tully Creek, KMN = Kinsman Fish Trap, KOR = Orleans. The line denotes 10 spores per liter which corresponds with 40% mortality threshold in Chinook salmon.
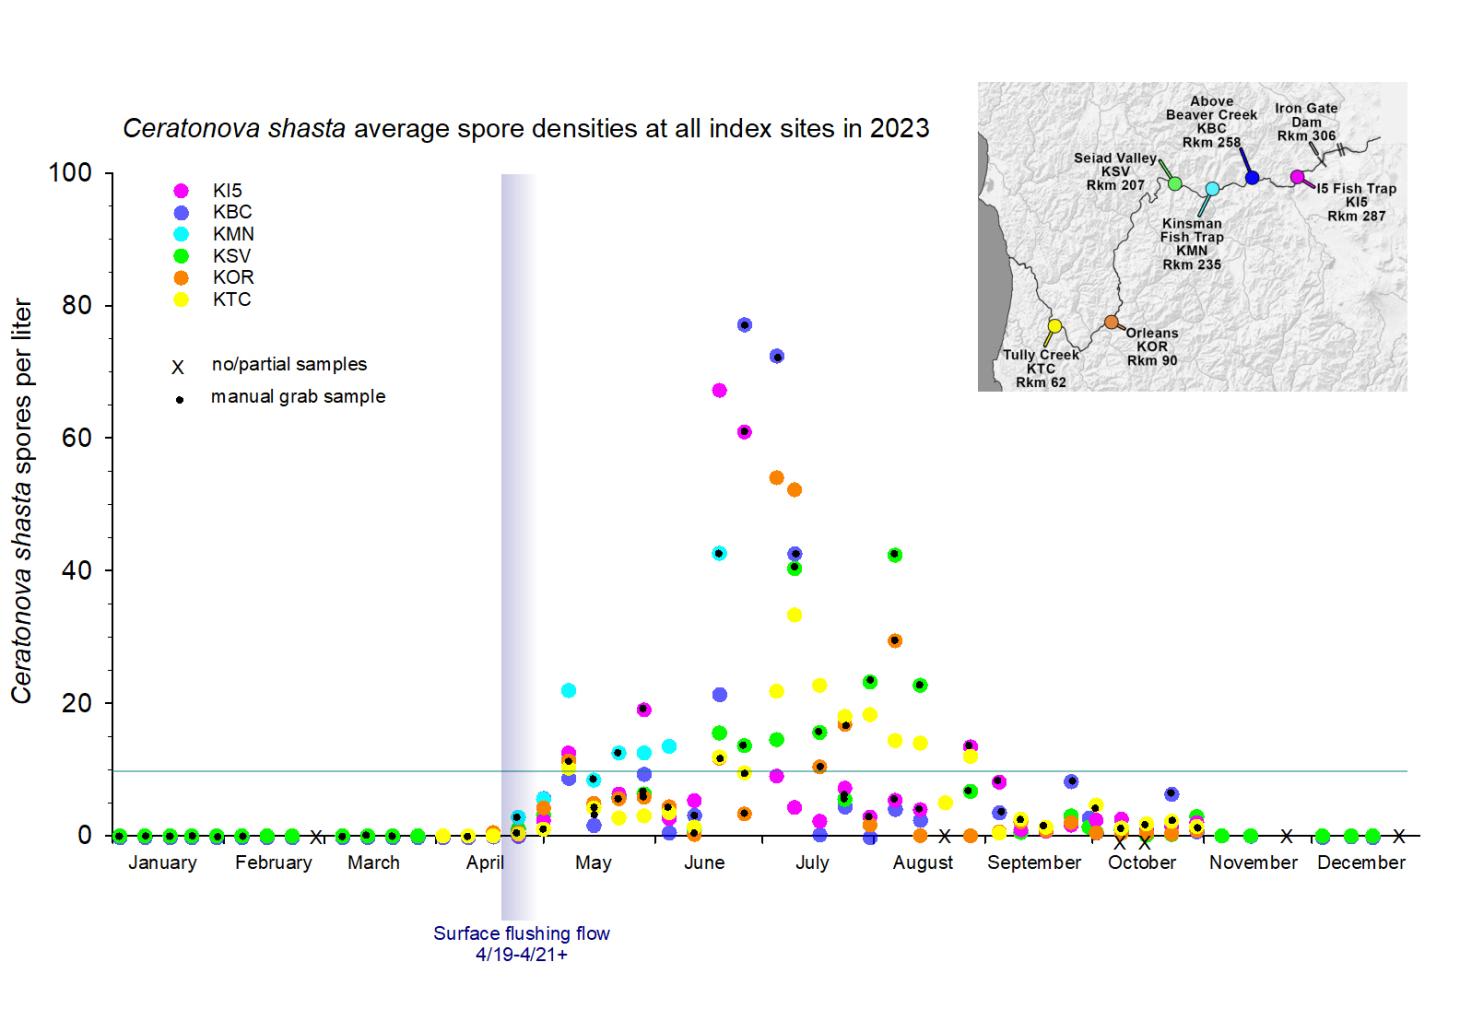
Density (average spores per liter) of Ceratonova shasta in 24-hour composite water samples collected at the mainstem index sites in 2023. Note that KMN is sampled only during salmonid outmigration, KBC and KSV year round and remaining sites April through October. KBC = near Beaver Creek, KSV = Seiad Valley, KI5 = near I5 bridge, KTC = Tully Creek, KMN = Kinsman Fish Trap, KOR = Orleans. The line denotes 10 spores per liter which corresponds with 40% mortality threshold in Chinook salmon.
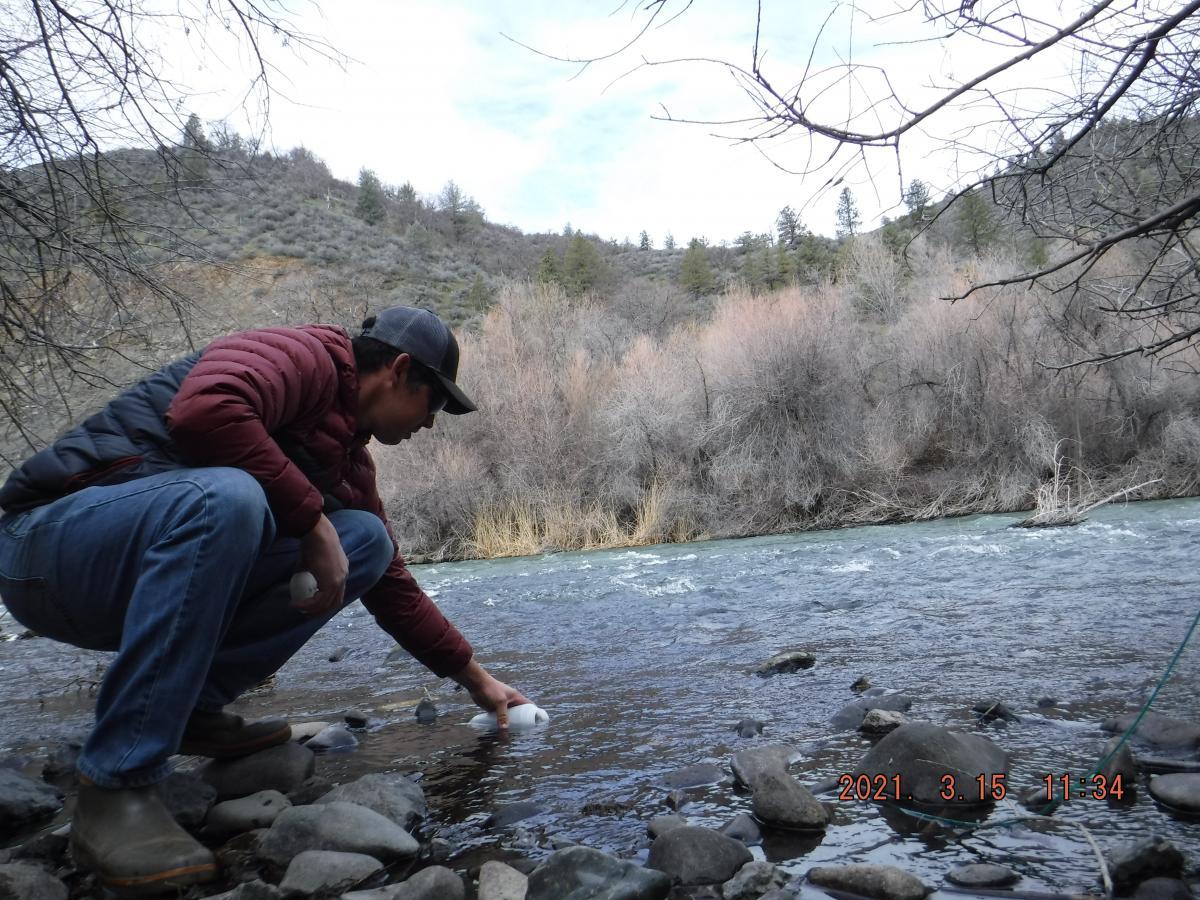
Manual water sampling by Karuk Tribal Biologist Larry Alameda at index site K-I5
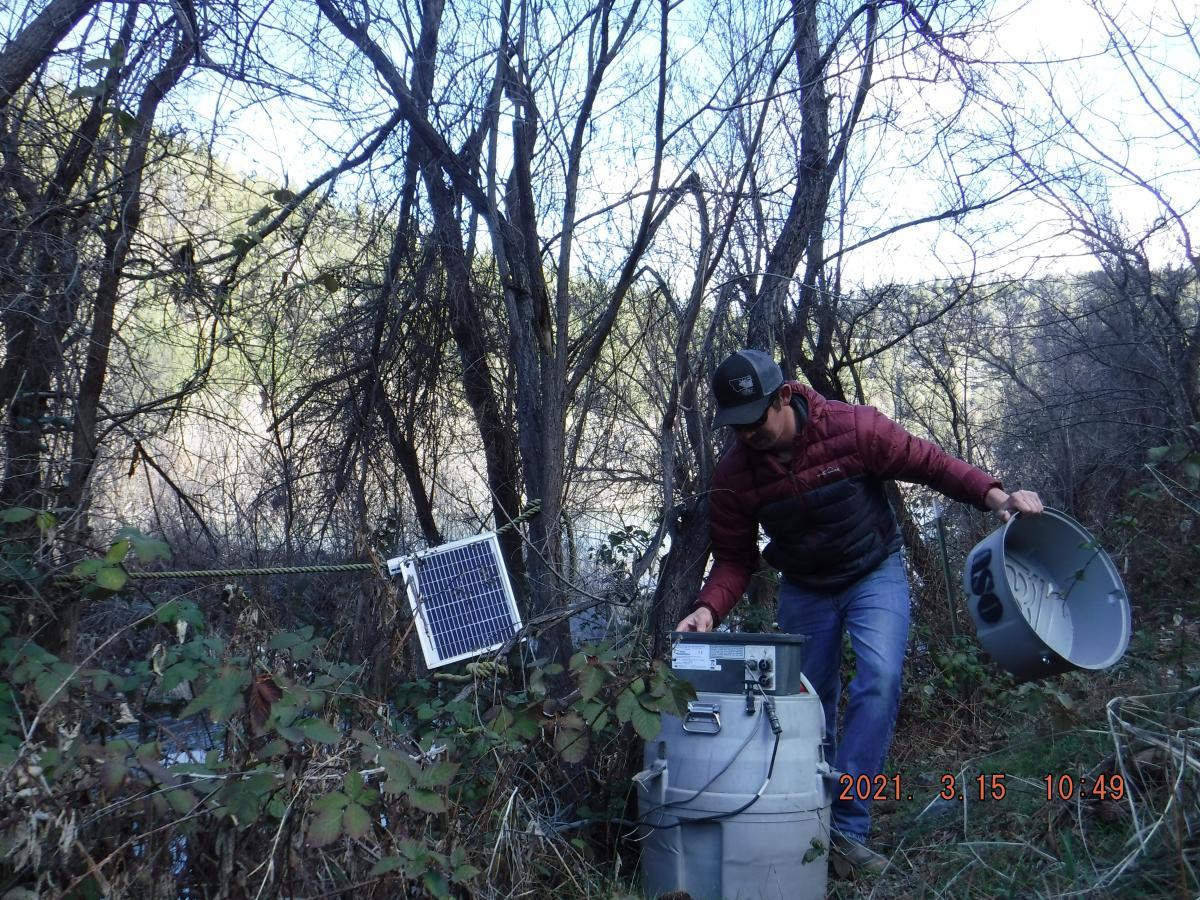
Solar powered automatic sampler at the Kinsman index site. An ISCO is used at all index sites but manual sampling provides a backup.
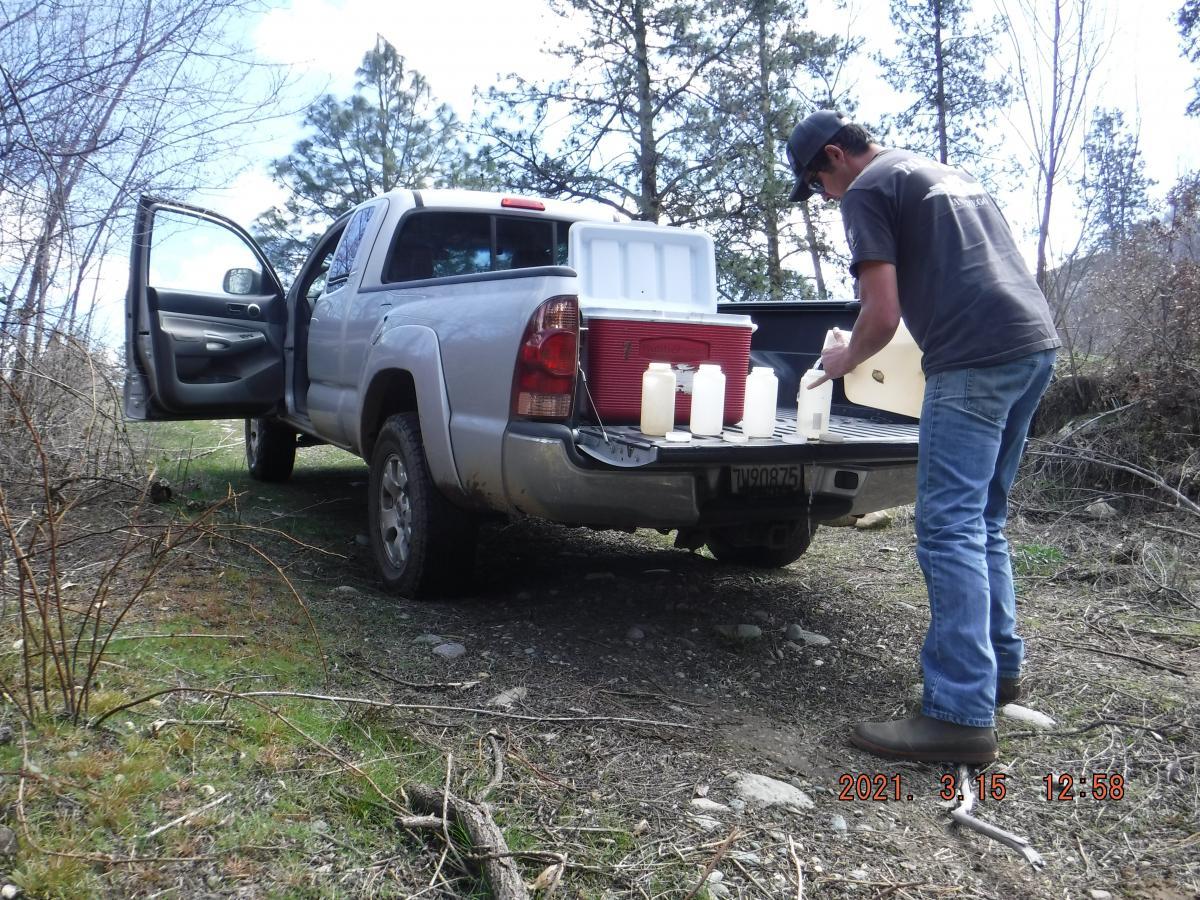
Collection of 4 1L technical replicate water samples from the larger 12L composite collected over 24 hours at KSV
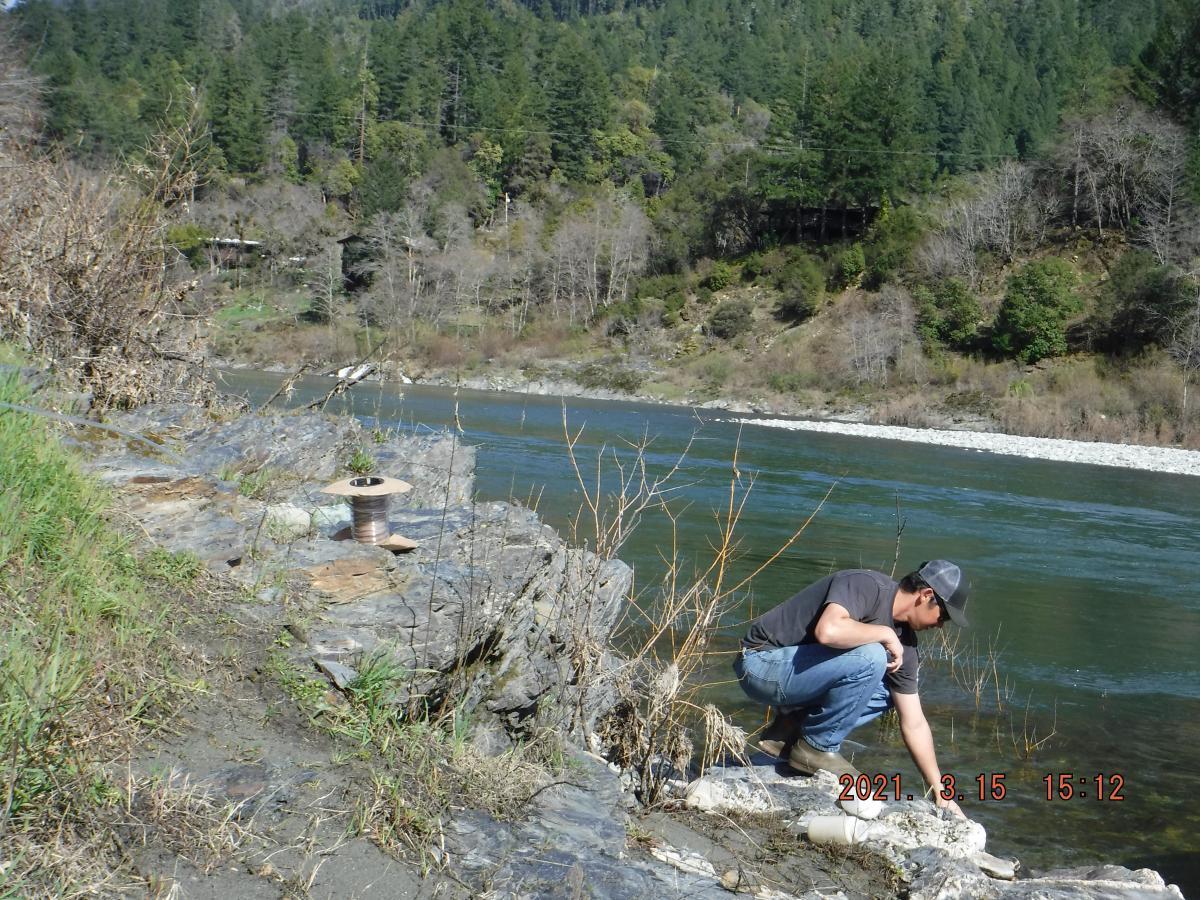
Manual water sampling at Orleans index site.
Photos courtesy of Karuk Tribal Biologist Larry Alameda
Annelid sampling
To monitor abundance and prevalence of C. shasta infection in the invertebrate annelid host, Manayunkia occidentalis, benthic samples are collected at seven sites in the Klamath River in fall, winter, spring, and summer. Sites span a discharge gradient; 2 are located in the upper basin downstream from Keno Dam, 2 are located in the hydroelectric reach, 3 are located in the middle basin downstream from Iron Gate Dam, and 2 are located in the lower basin downstream from the Scott River. Although samples are routinely collected in fall, winter, spring, and summer, they are also scheduled to occur prior to and after flooding or pulse flow events (when possible). Samples are processed to determine density, simple demographics, and the prevalence of myxozoan infections including C. shasta and P. minibicornis.
2024 Update: Annelids were sampled in March, May, June (intensive work in mid basin with USFWS) and July in 2024. The fall sampling is planned for early November 2024. In 2024, annelids were most abundant at upper and middle basin sites in March, which contrasts with other years- when annelids are most abundant in warmer months from late spring to fall. Although the mechanism has not yet been determined, we hypothesize that sediment associated with dam deconstruction activity and fire disrupted annelid populations leading to the lower abundance in warmer months. Density and infection assays are in progress.
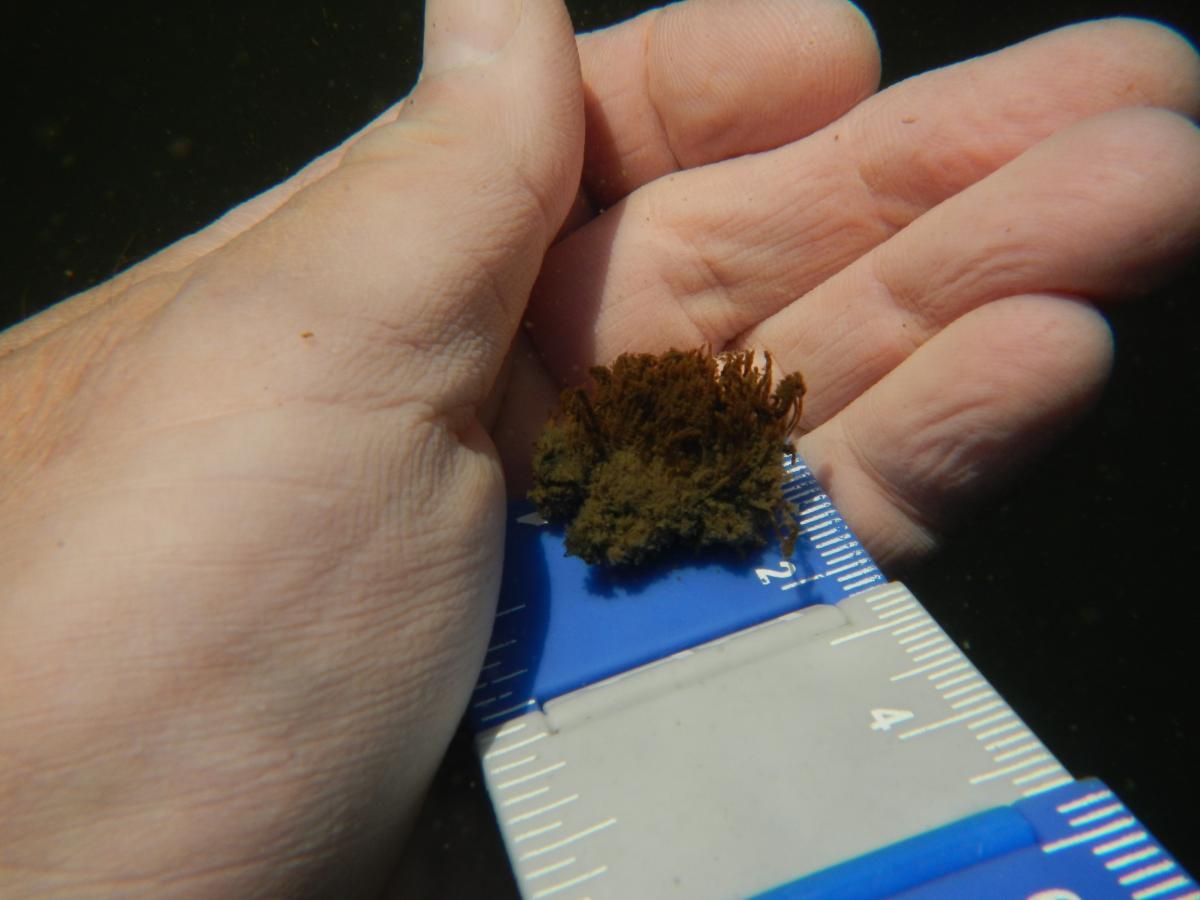
Manayunkia occidentalis tubes from the image on right
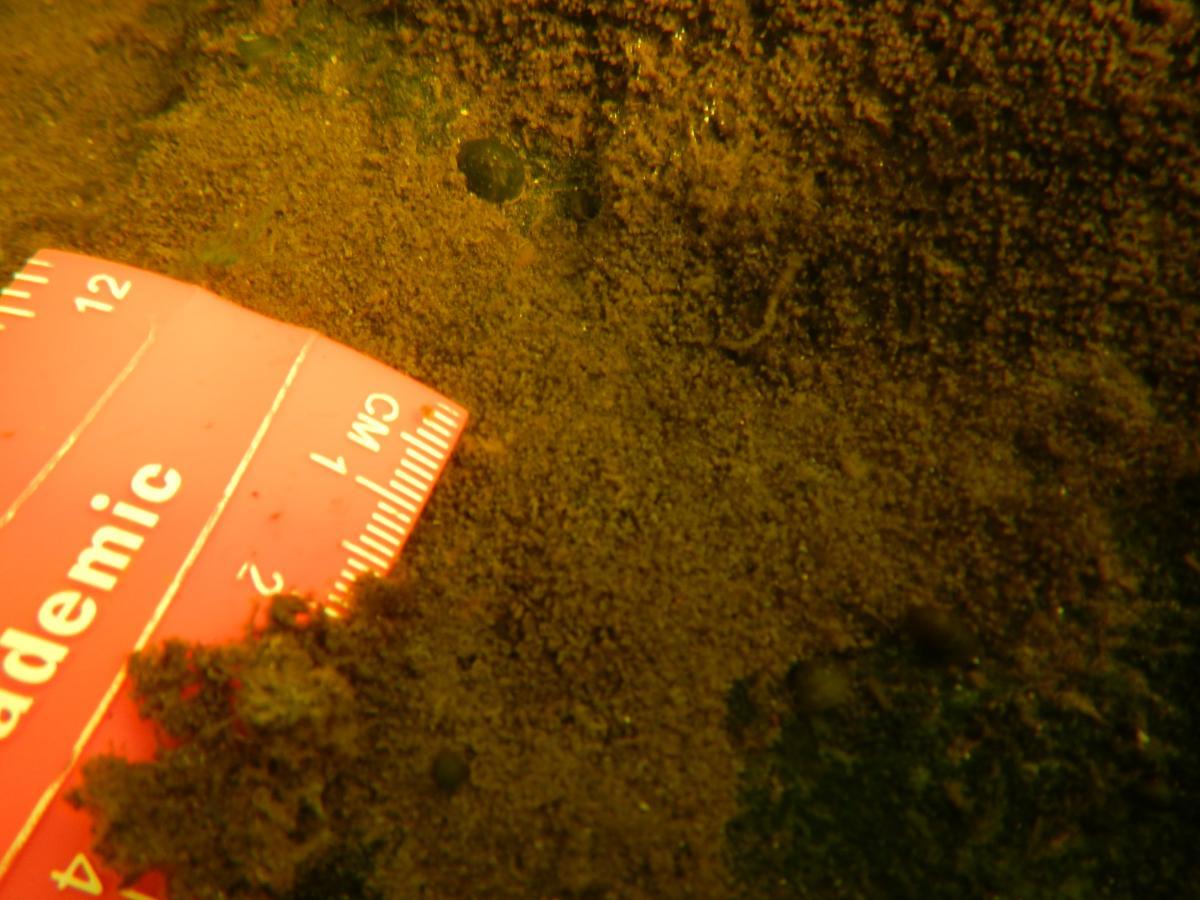
A high density assemblage sample at TOH
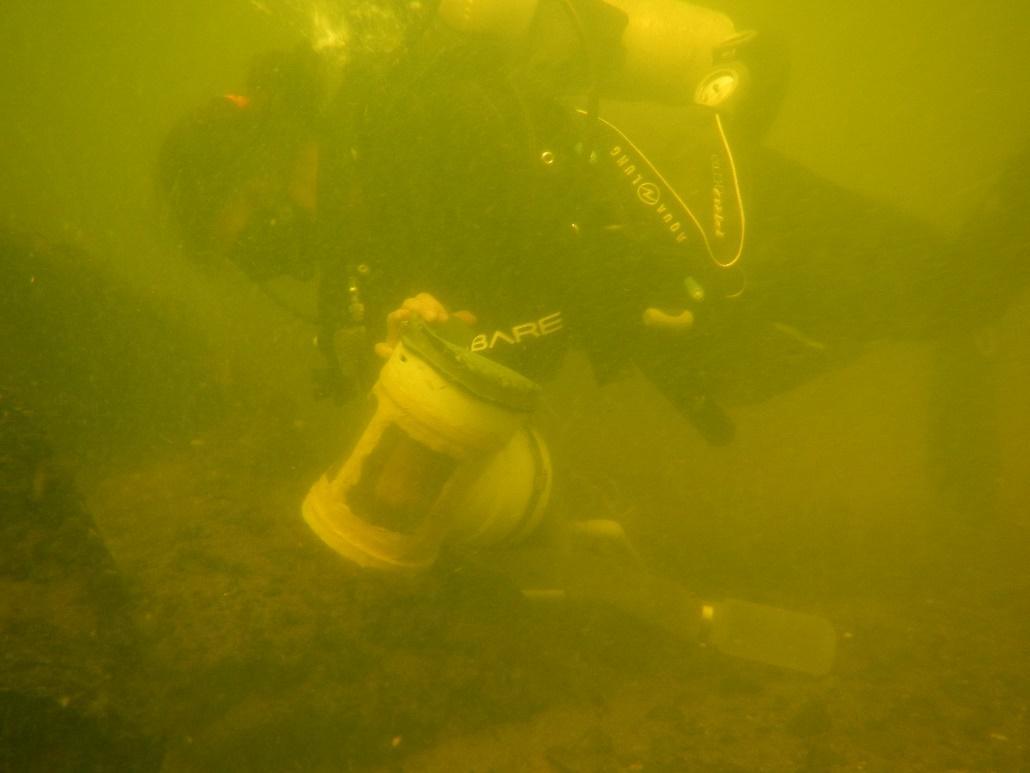
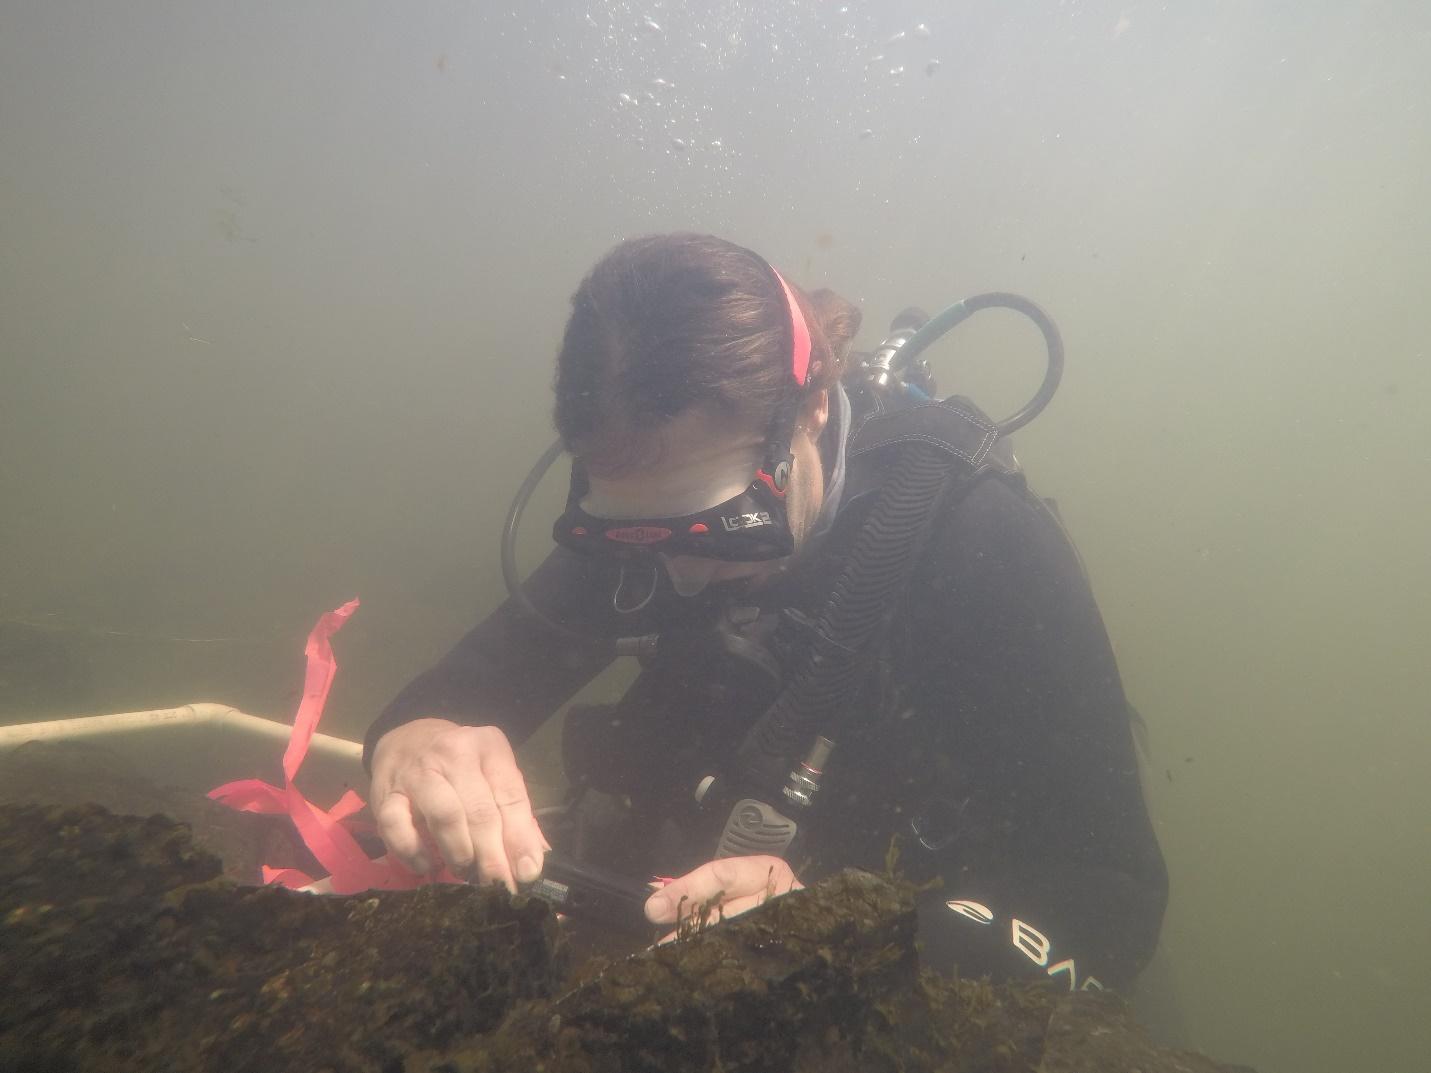
Diver collecting a benthic sample from boulder substrate at the TOH reach. We use a modified Hess sampler fitted with 80um Nytex mesh netting and a 500mL Nalgene collection bottle. Samples are preserved in ethanol until processing.
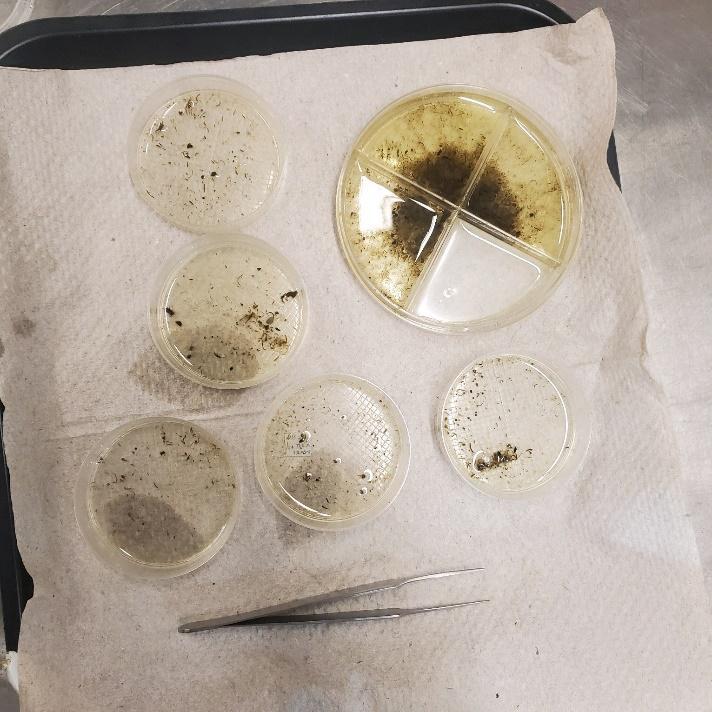
Benthic samples are fractioned prior to sorting.
Dr. Alexander photographing annelids on riprap substrate at the KBC monitoring site.

Annelid sampling at the KI5 reach. Foreground diver measures depth and velocity, while background diver measures substrate grain sizes.
Annual reports
Annual reports for Bureau of Reclamation funded studies for 2015 onwards are available. Please contact Sascha Hallett (halletts@oregonstate.edu). Annual reports are submitted June 1 the year after the research year.
Annual Klamath River Fish Health Workshop
We are pleased to announce this year's Annual Klamath River Fish Health Workshop to be held in Yreka, on Tuesday May 21st. We gratefully acknowledge our Karuk collaborators for hosting us at their Karuk Tribe Housing Authority, Yreka Apsuun Community Center.
This year, the KRFHW will precede the Spring KBMP meeting to be held Wednesday May 22nd at the same venue (please see emails from Randy Turner for KBMP specifics).
The general KRFHW schedule will be as follows:
Workshop: Tuesday May 21st (9am-5pm). Full day, public forum during which Klamath River fish health research updates, overviews, and presentations will be shared with an open forum Q & A session. Presentations will be basin-wide. Plans for 2024 and beyond will also be shared. The May 21 workshop will be open to the public to promote an open exchange of information, and attendance for all is free, however, we do request that you register your intention to attend on this spreadsheet.
The meeting format will be in-person. The agenda can be found here.
Project Planning Session: Wednesday May 22nd (8:30am-11:30am). Half day, smaller meeting to coordinate research efforts and management needs. The Project planning session is reserved for fish health researchers to discuss 2024 and beyond study plans and to promote project coordination and collaboration. The planning session will include an opportunity for Q & A between fish health researchers and agency/tribal co-managers. The meeting format will be in-person.
We look forward to seeing many familiar faces at this annual workshop on fish health related research in the Klamath River Basin!
Related Stories
Across the Department


Alumni and Friends